Alcove
Carbon Inventory Management
Led the end-to-end design of the product, defining the data model, workflows, and interfaces to help suppliers accurately track carbon credit inventory across projects and time. Worked closely with customers, engineers, and domain experts to translate complex and constantly changing credit accounting rules into a clear, auditable system that supports forecasting, traceability, and compliance.
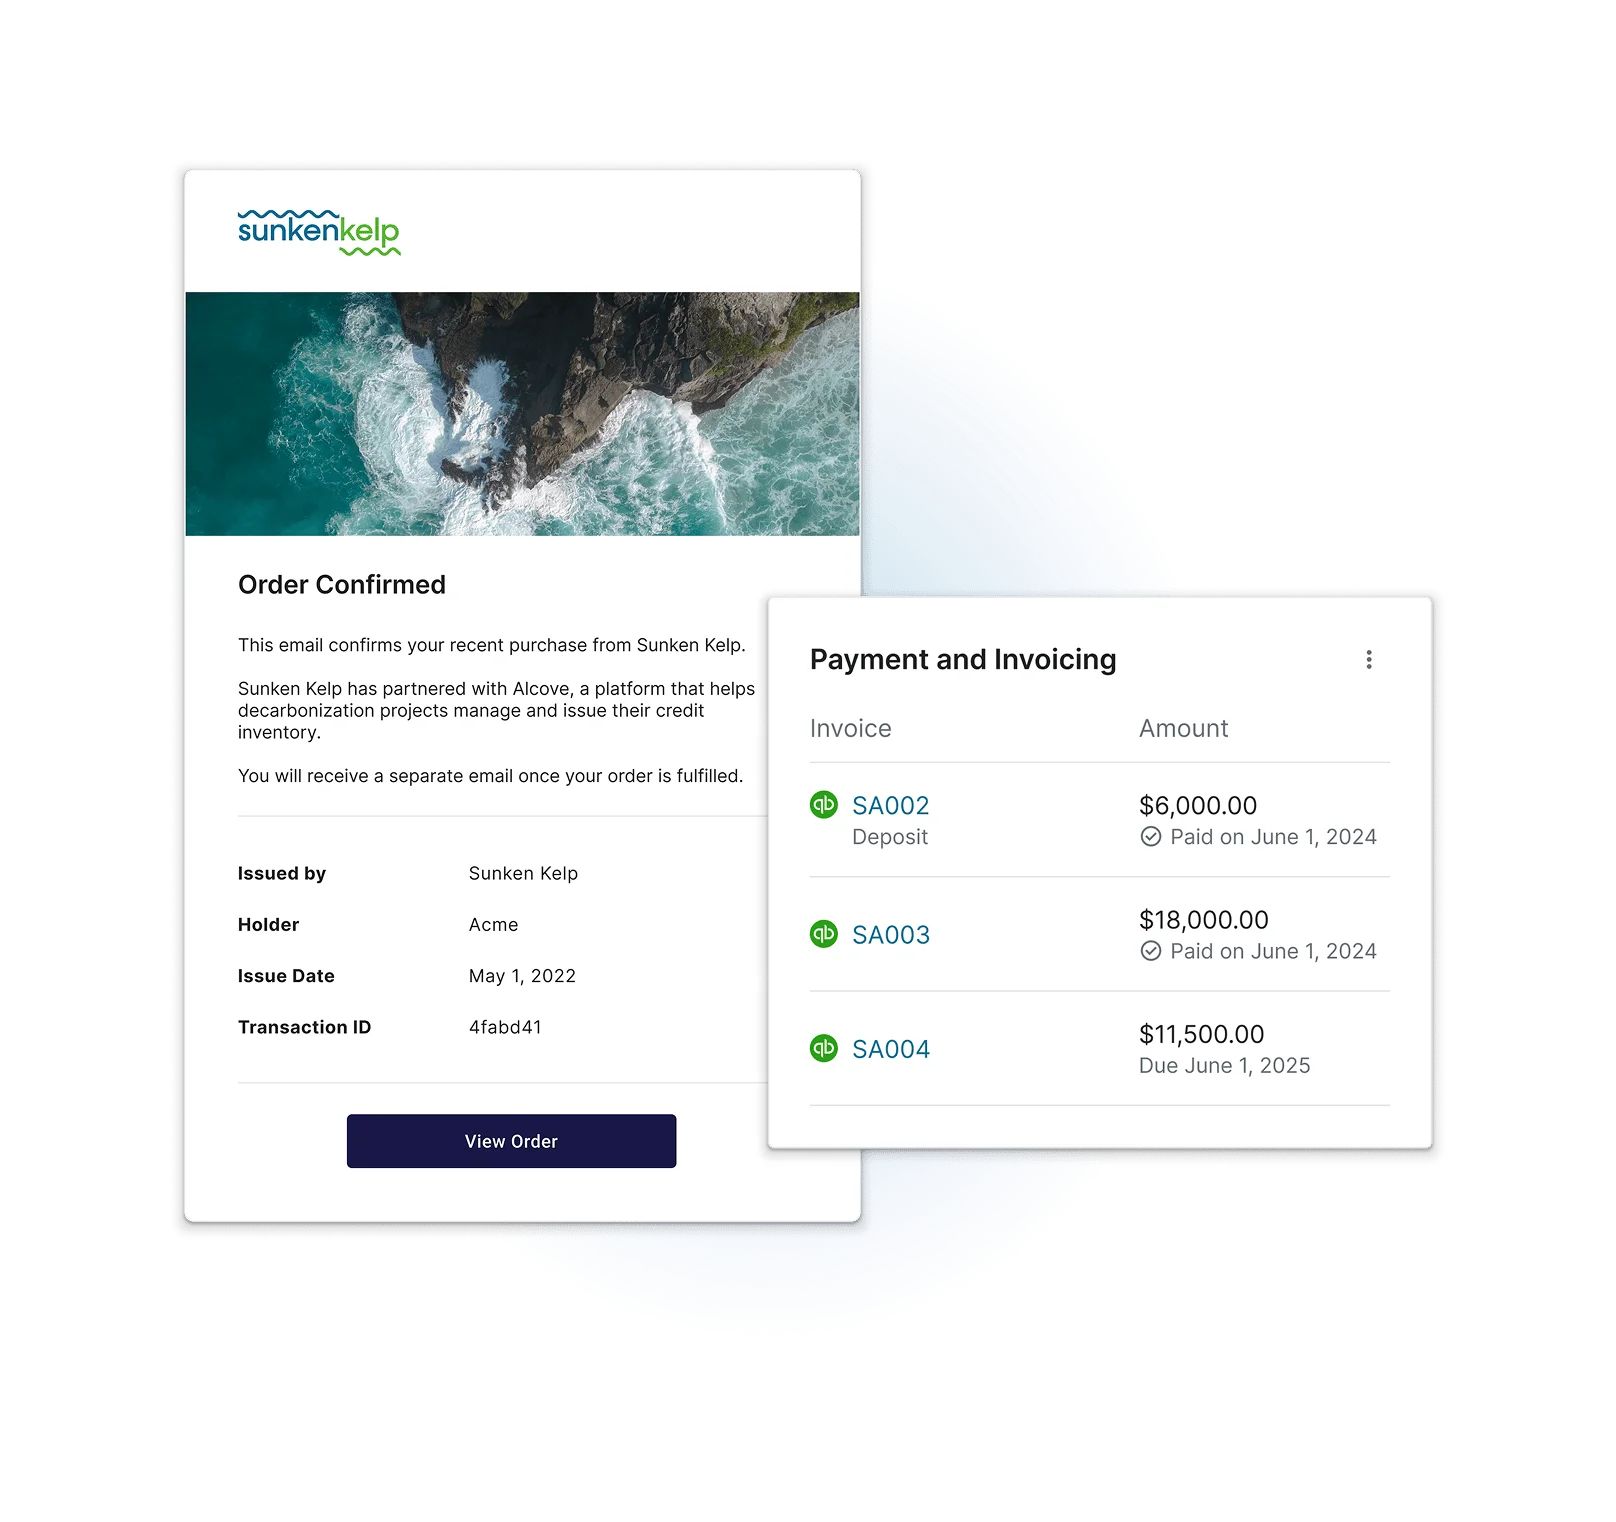
Carbon removal suppliers need a reliable way to manage their credit inventory from day one. Spreadsheets are a common starting point, but even early on, they make it nearly impossible to track changes across forecasted supply, realized issuances, spot purchases, and forward sales.
Without a system purpose-built for the complexities of carbon removal, sales, operations, and compliance quickly fall out of sync. This creates friction across teams, limits visibility, and makes operations difficult to scale.
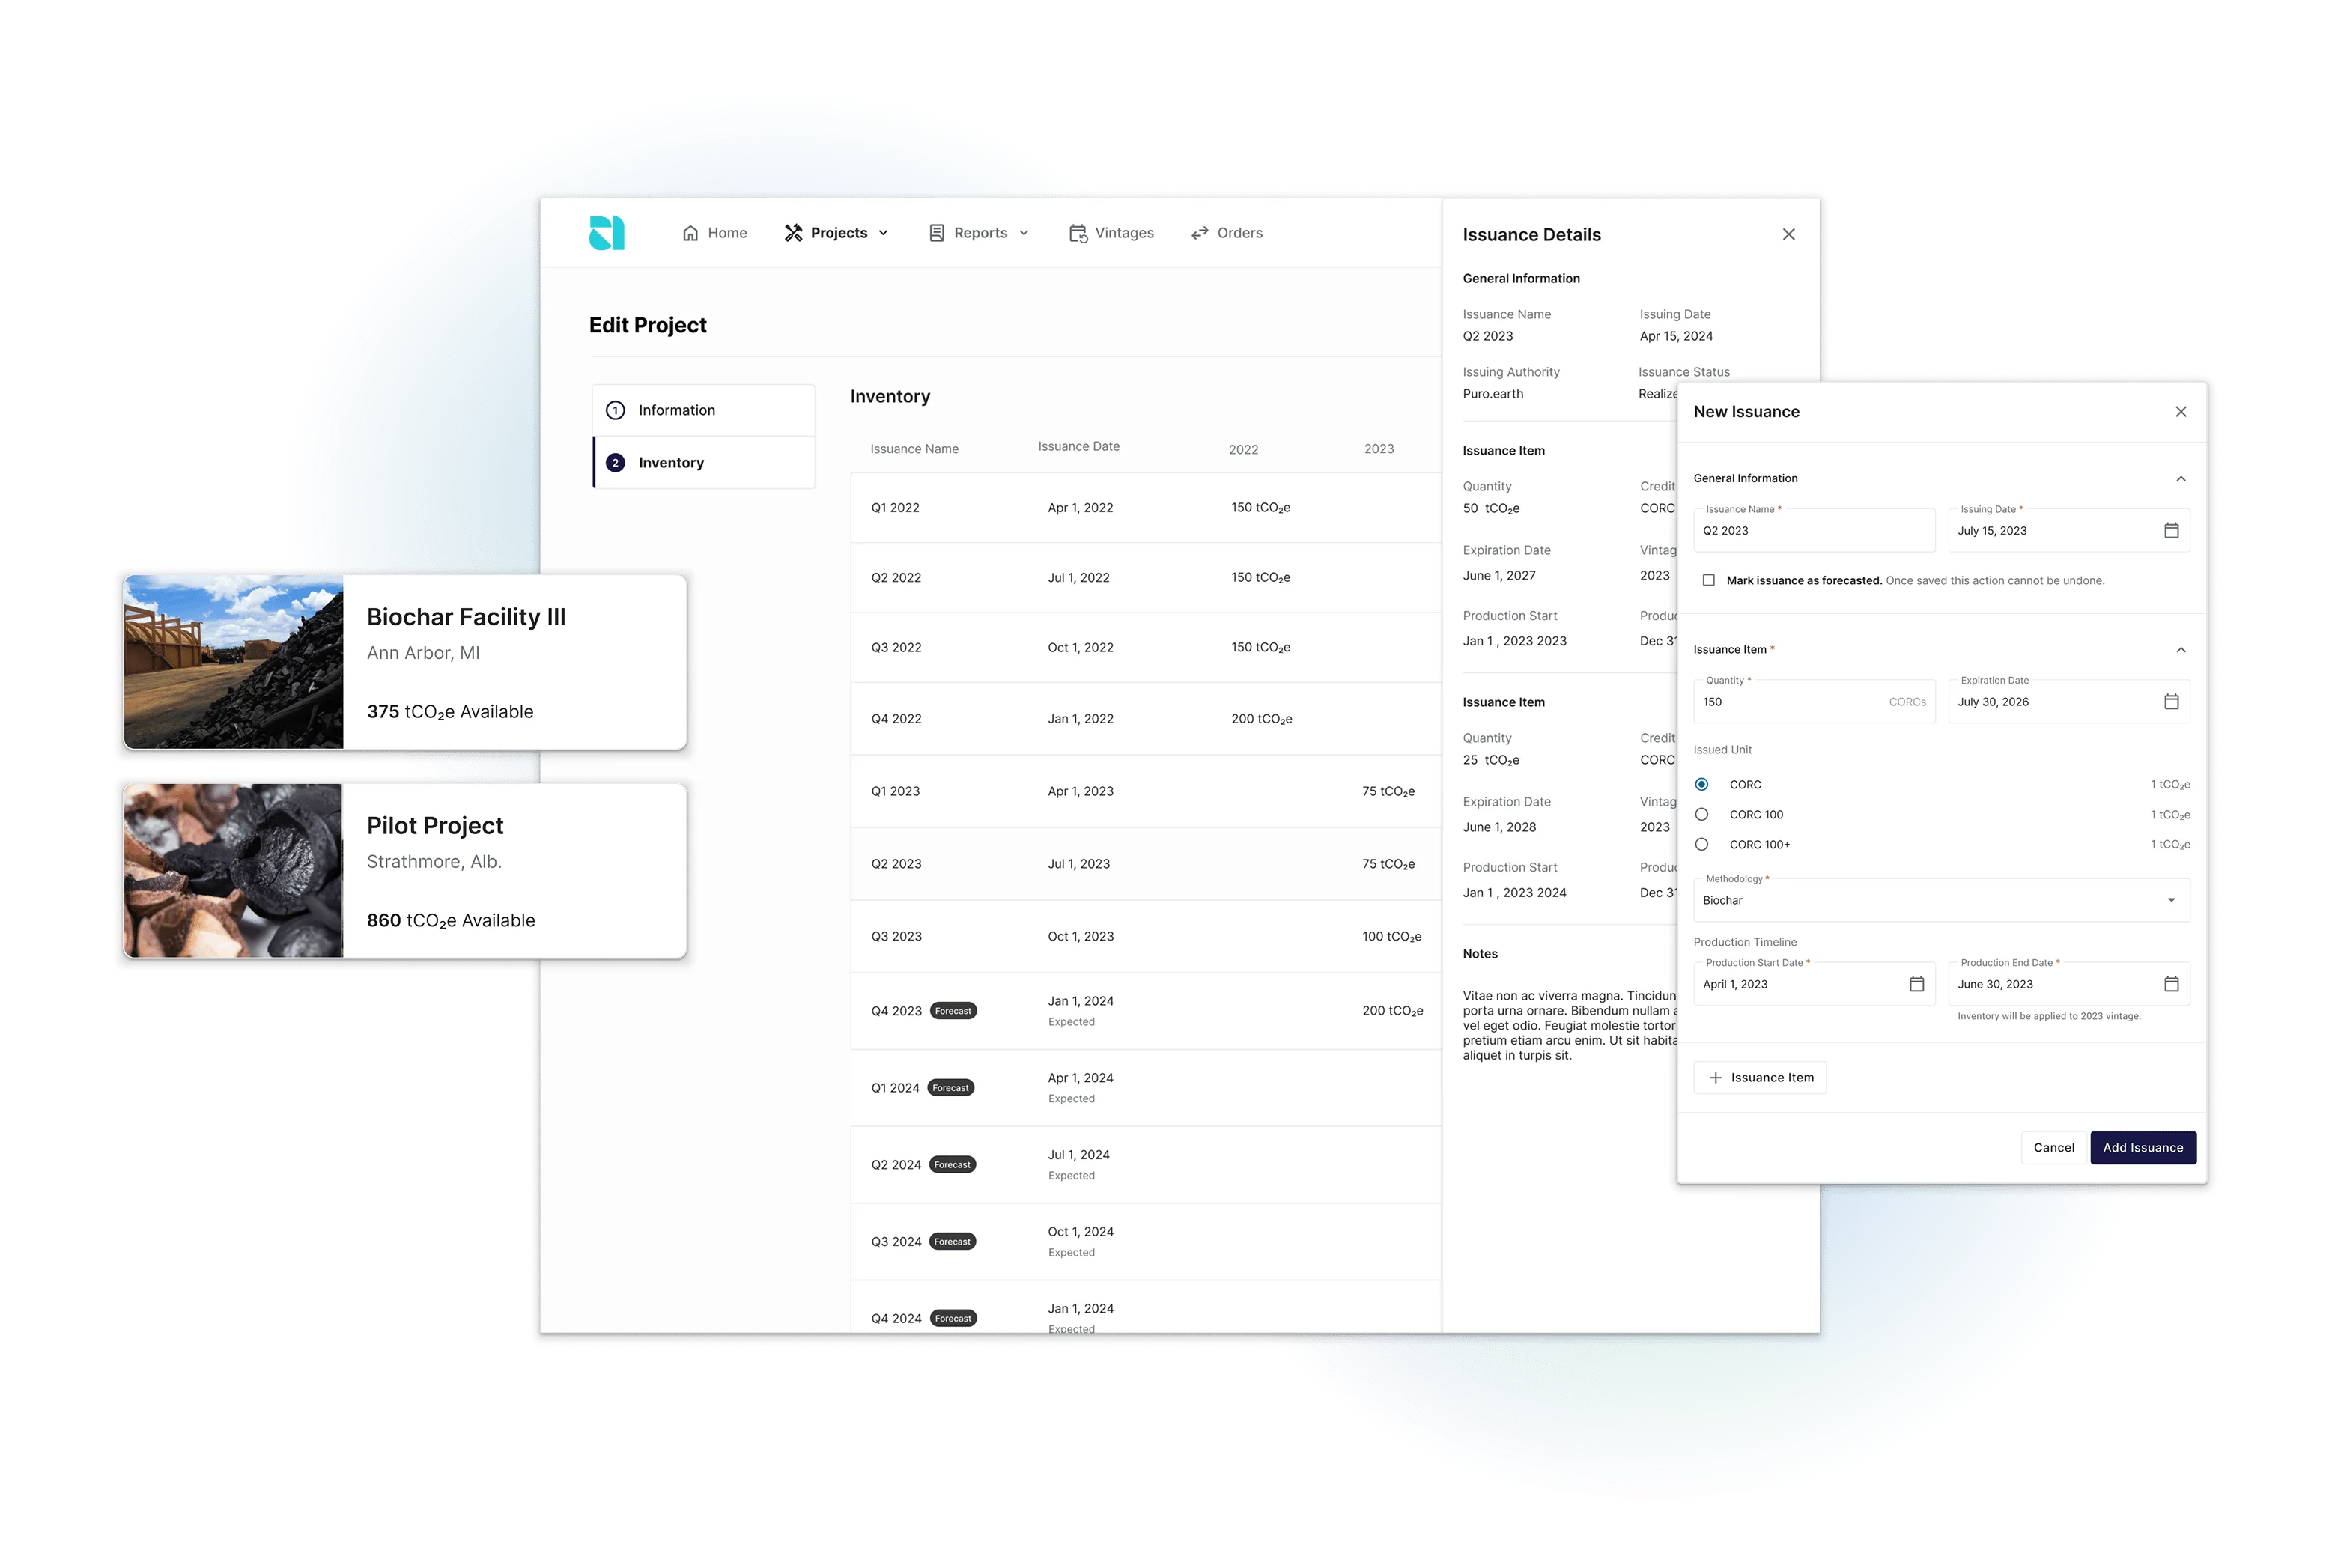
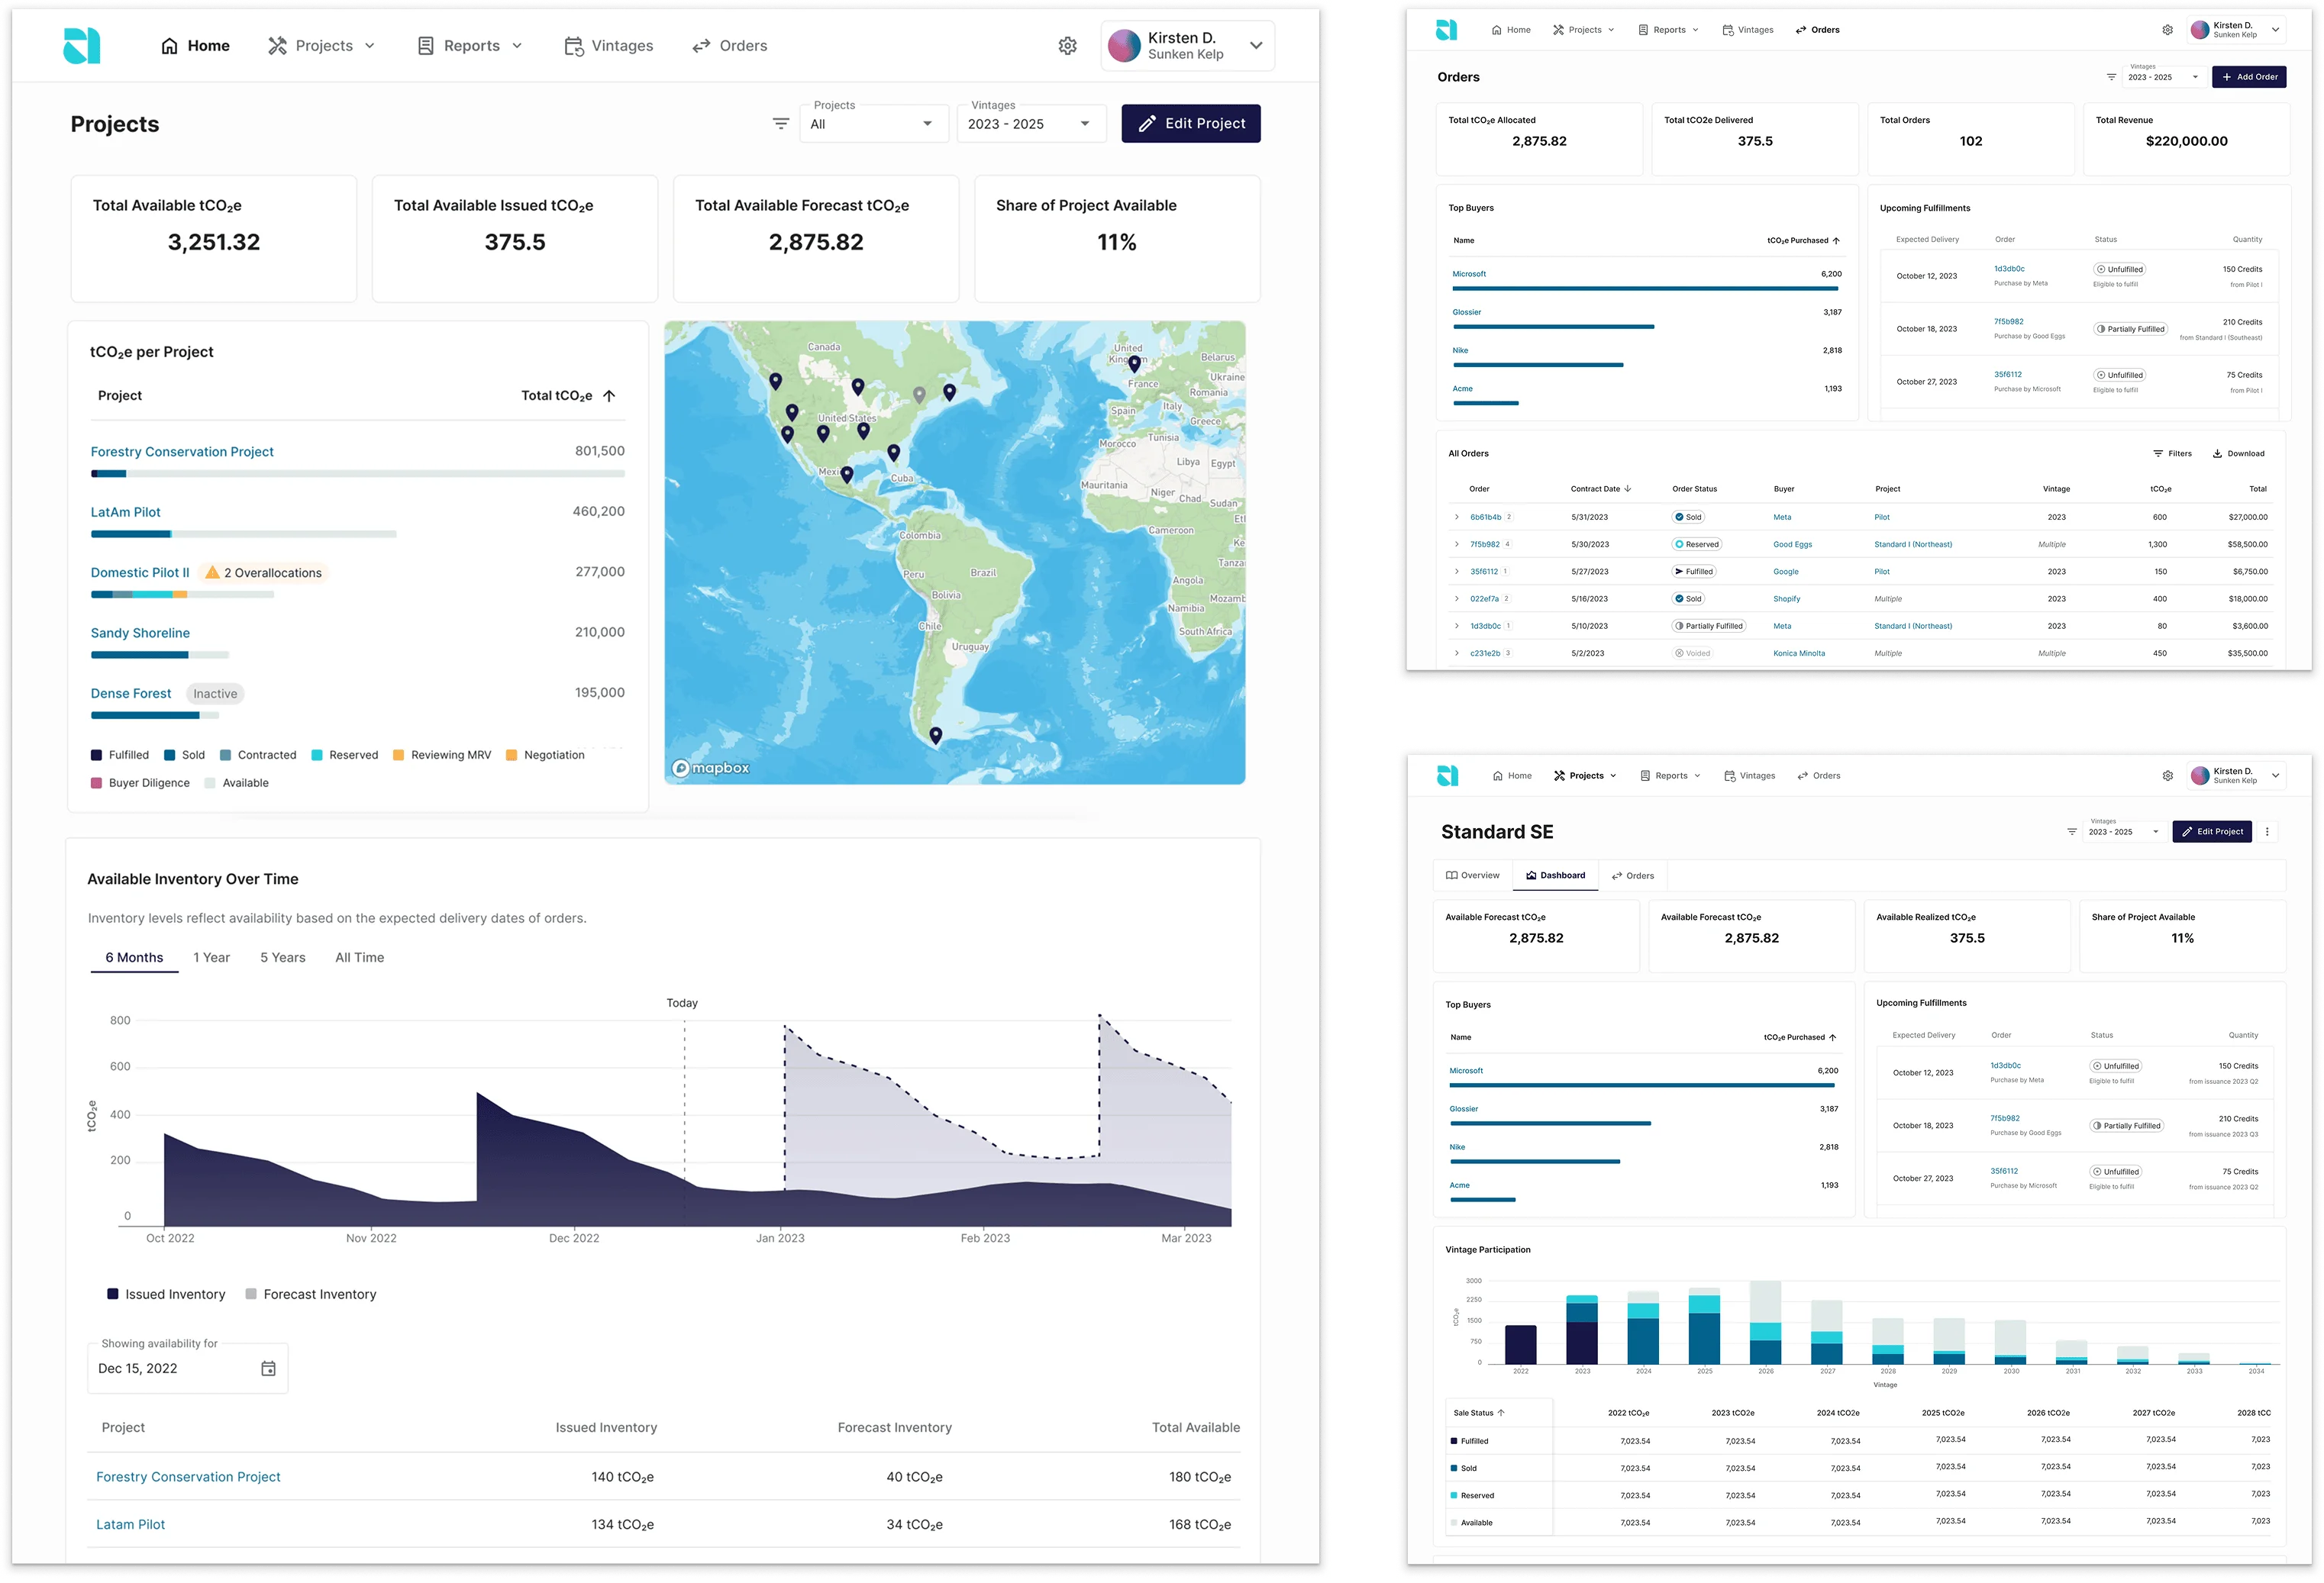
The system is designed with project inventories at the core, since that’s how suppliers naturally think about and organize their credits. Each project stores key details like methodologies, locations, and partners, making it easier to keep everything connected and audit-ready. We decided to split inventories into two states, Forecasted and Issued, to give users more flexibility early on, and introduce stricter guardrails as credits are formally issued. The inventory page provides a clear, editable view of overall supply, while letting users dive into the details of each issuance when needed.
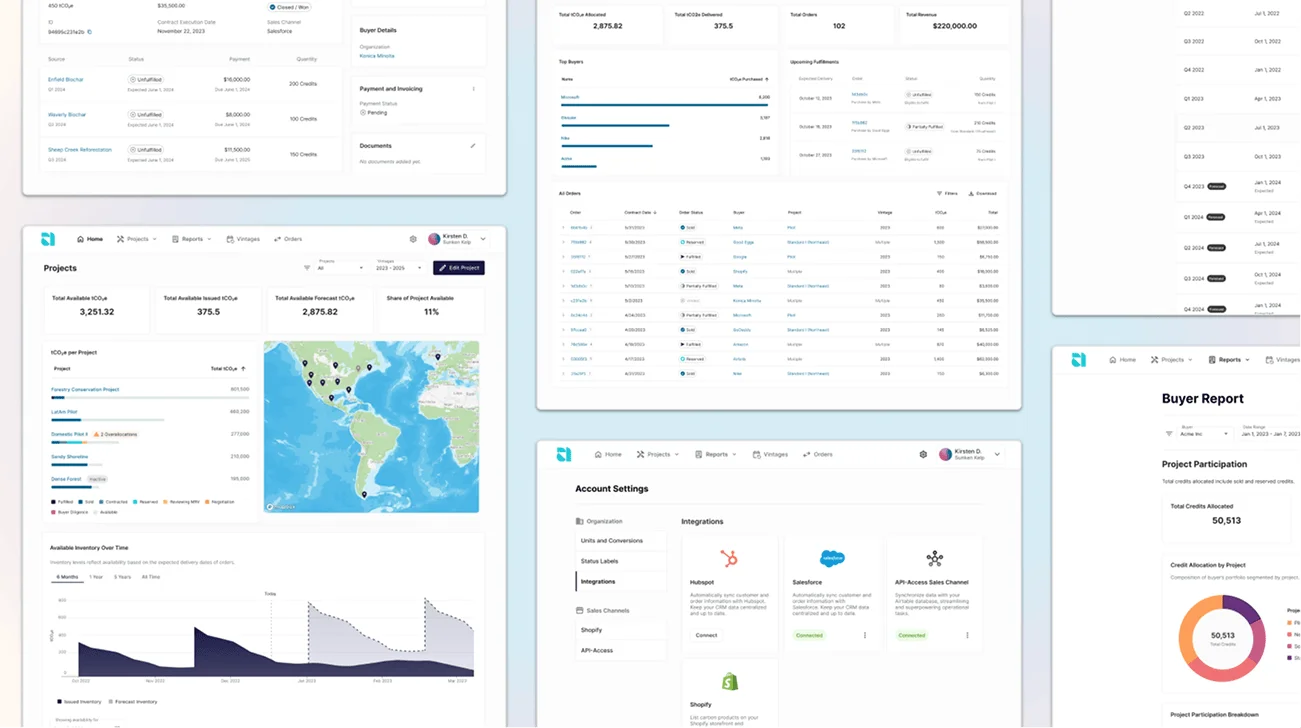
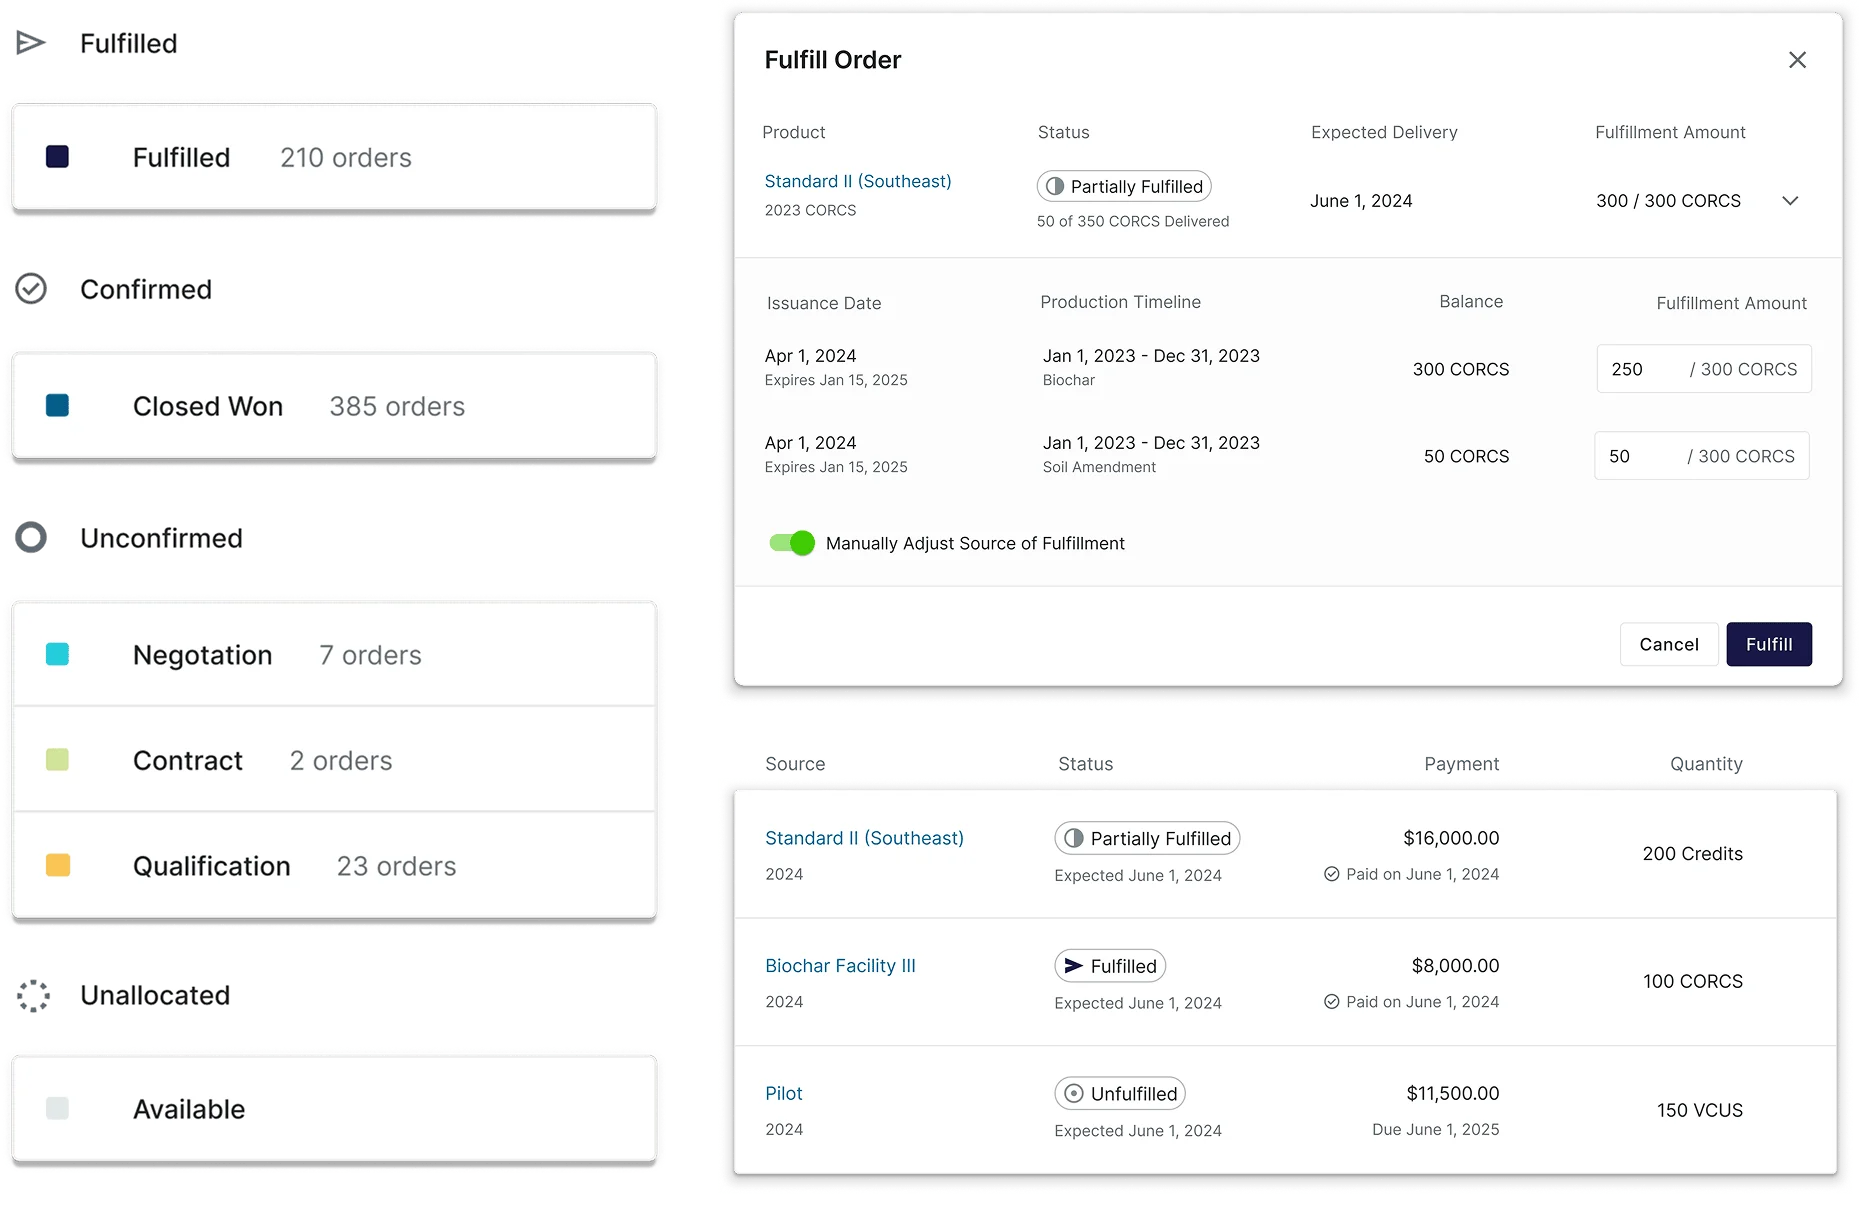
Dashboards are the main surface users interact with and sit at the core of the system. We designed them to show how credits move through the lifecycle across projects, while also surfacing issues like over-allocations and overdue payments or deliveries. These views help sales and ops teams stay aligned, spot problems early, and make faster, more informed decisions—without digging through spreadsheets.
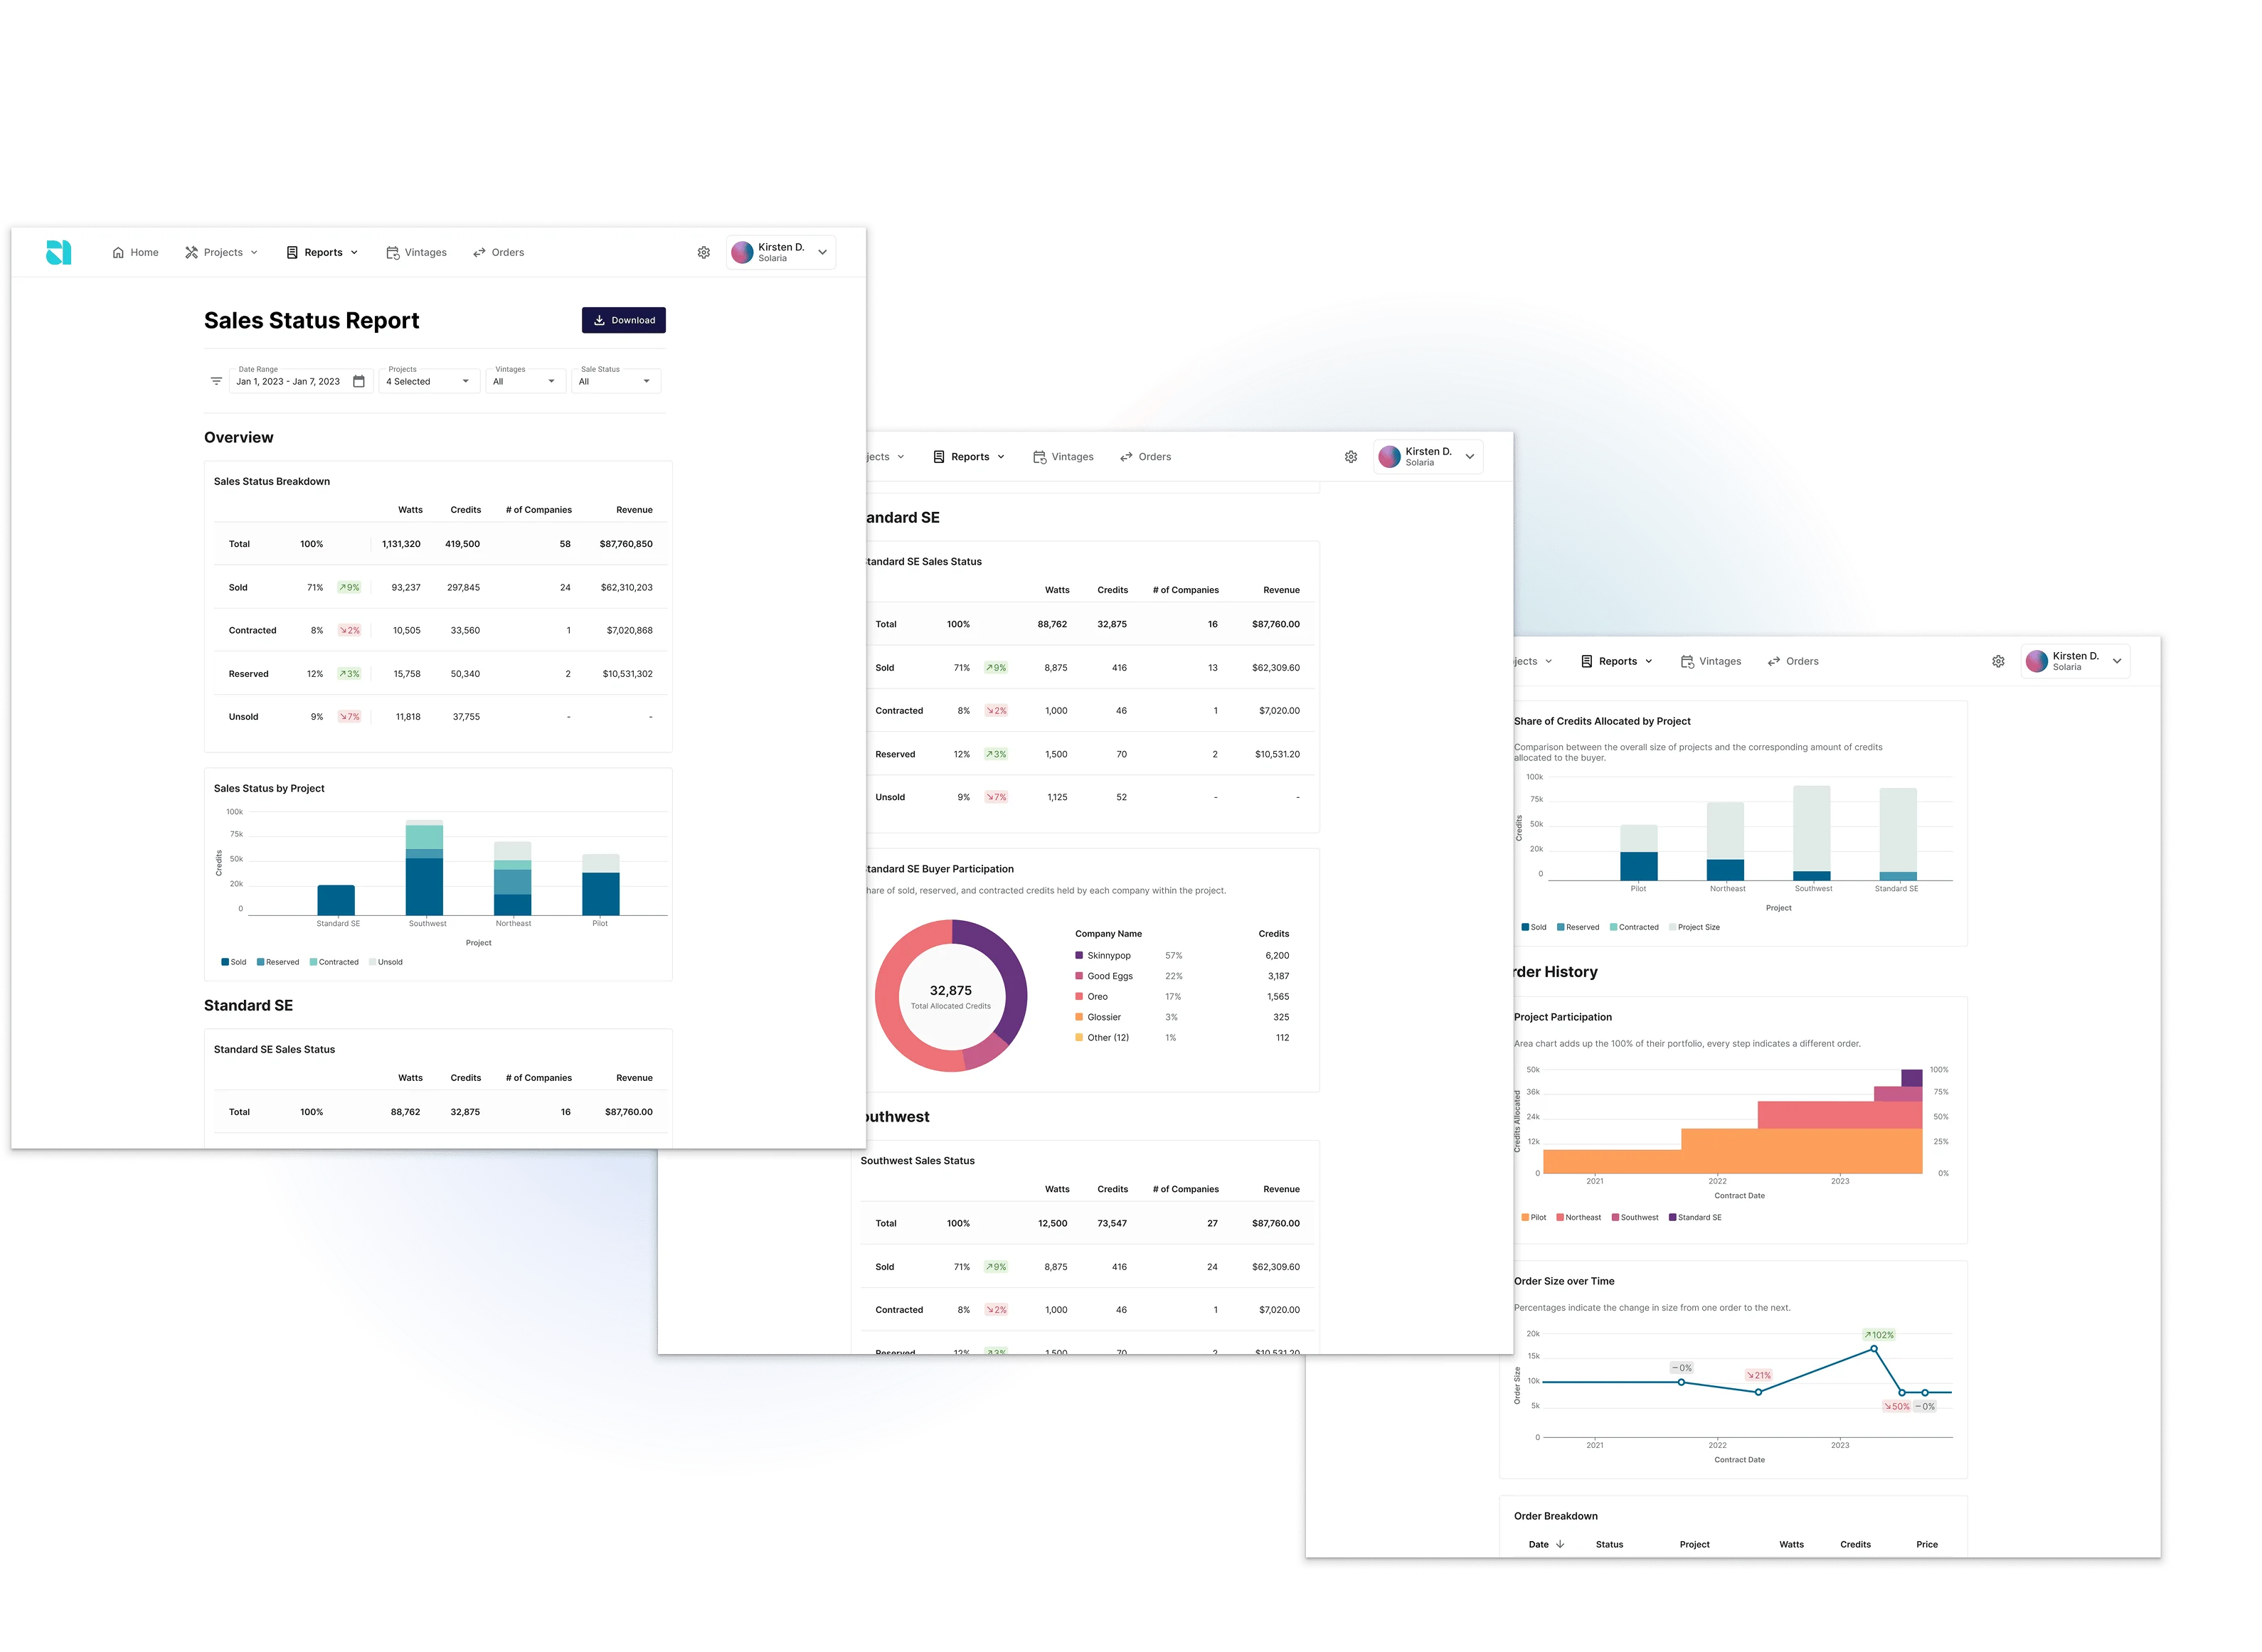
We worked closely with users who were manually pulling data into spreadsheets and slide decks every single week to build reports that actually saved them time. Each report is purpose-built to answer specific questions—like how much has been sold, to whom, and how sales are trending over time. Users can apply filters and date ranges to track progress against targets or pull snapshots for stakeholders. Instead of exporting and rebuilding the same views over and over, they now have a reliable, up-to-date source of truth.
The system now houses over 50 million tons of carbon and is used by some of the leading suppliers in the industry, those with the most projects and the most operational complexity. For teams previously relying on spreadsheets, it’s saved hours of manual work each week. For others, it’s eliminated the need to build and maintain costly custom systems. Most importantly, it’s allowed suppliers to focus on removing carbon, not wrangling data.